Software systems testing is a widely used, scalable, and efficient technique to discover Software systems defects. However, generating sufficiently many and diverse test cases to obtain good coverage of the software system under test is challenging. It is therefore important to use test adequacy criteria to measure and evaluate the extent to which sufficient test cases have been generated and executed against the system under test.
To address this challenge, our approach [1] focused on execution path coverage which can be considered as a test adequacy criterion that assesses the degree to which the testing model has been explored. Our approach relies on the use of a trie data structure to capture execution paths of test cases and proposed visualization abstractions as the foundation for path coverage visualization. The visualization of execution path coverage can provide a better overview of how the different parts of the model have been explored, if the tests have redundancies, and if any parts of the system are hard to reach via the test case generation. To evaluate our approach, we have performed experiments on a collection of examples, including the ZooKeeper distributed service.
Design
We considered that a finite execution path of a test case is a sequence of transitions starting from the initial state and leading to a terminal state. We first designed a technique to capture execution paths of test cases of models for the systems under test using a trie data structure. As an example, consider a test suite consisting of three execution paths: p0=[a→b,b→b,b→c,c→d], p1=[a→b,b→b,b→b,b→c,c→d], and p2=[a→b,b→b,b→e], where a, b, c, d, and e are states. → denotes a transition from one state to another state; for example, a→b means a transition from the state a to the state b. These three execution paths can be recorded and represented by the trie data structure shown below, where the node labeled root represents the root of the trie. Each non-root node in the trie has been labeled with the transition it represents. As an example, node 1 represents the transition a→b. All the three execution paths stored in the trie have a→b followed by b→b as a (common) prefix. Each non-root node also has a label representing the transition counters associated with the node. For example, the transition b→b associated with node 2 has been taken three times in total. Two paths, (p0 and p2) execute this transition once (label trc=1:tpc=2), while one path p1 executes it twice (label trc=2:tpc=1). Note that this data structure is not a direct visual representation of the paths and it is not the trie data structure that we eventually visualize in our approach.

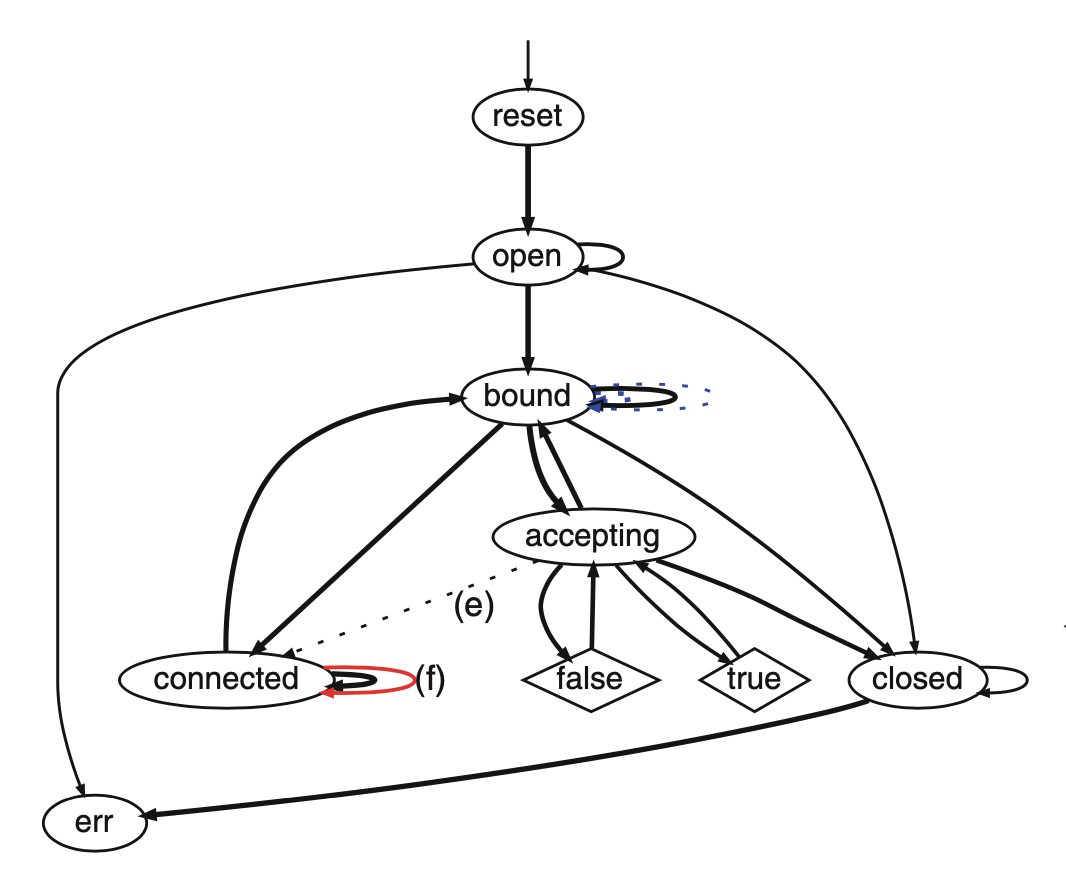
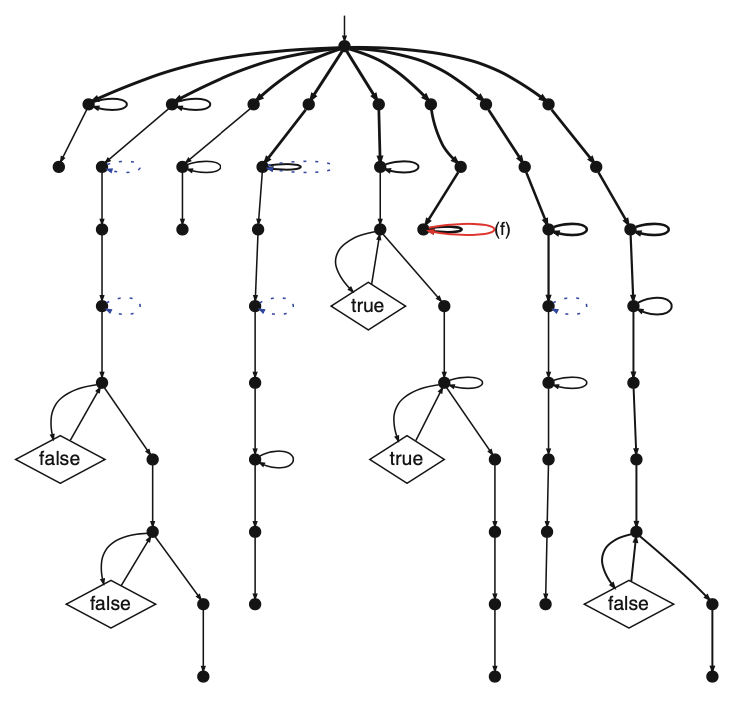
with recorded all execution path of generated test cases from the model of the system under test, we then designed a technique to measure and visualize the execution path coverage criterion of test cases using designed graph abstractions into two types of visualizations for path coverage, so-called state-based graphs (SGs) and path-based graphs (PGs). The abstractions we have designed and developed to simplify these graphs enabled us to deal with the complexity of moderately large systems. Our visualization approach also relies on the attributes of graphs including the edge thickness to visualize the frequency of transitions on executed paths and edge colors of the graphs to show what kinds of tests succeed or fail. The figures below show a SG (left) and a PG (right) for the Java server socket model with ten test cases executed, including failed transitions in red and labeled with (f).


Implementation & development of software tools
-
Developed a path coverage visualizer tool in Scala, which was included as a new feature for the Modbat Tester 3.4 release, to record execution paths of test cases in the trie and to visualize execution path coverage using two types of simplified graphs with the aid of designed graph abstractions.
-
The automated testing environment was developed using shell scripting.
Testing & Evaluation
We applied the visualizer to measure and visualize execution path coverage of test cases of a collection of examples, including the ZooKeeper distributed coordination service. The results showed that the SGs are good at giving an overview of the models based on extended finite state machines with detailed information about executed states and transitions; the PGs show distinct executed paths well, with a particular focus on giving information on linearly independent path coverage which can be considered as a test adequacy criterion. The visual feedbacks successfully gave testers confidence about how well the testing models were explored by the generated test cases and what kinds of tests succeeded or failed.
References
- R. Wang, C. Artho, L. M. Kristensen, and V. Stolz. Visualization and Abstractions for Execution Paths in Model-Based Software Testing. In Integrated Formal Methods, volume 11918 of Lecture Notes in Computer Science, pages 474–492, Springer International Publishing, 2019.
- C. Artho, A. Biere, M. Hagiya, E. Platon, M. Seidl, Y. Tanabe, and M. Yamamoto, “Modbat: A model-based API tester for event-driven systems,” in Haifa Verification Conference, ser. Lecture Notes in Computer Science, vol. 8244. Springer, 2013, pp. 112–128.